Market Outlook
January 17, 2018
Market Cues
Domestic Indices
Chg (%)
(Pts)
(Close)
Indian markets are likely to open flat tracking global indices and SGX Nifty.
BSE Sensex
(0.2)
(72)
34,771
US stocks turned lower over the course of the trading session. The major averages
Nifty
(0.4)
(41)
10,700
reached record intraday highs early in the day but eventually closed in negative
Mid Cap
(1.7)
(315)
17,814
territory.The Dow Jones ended on a flat note at 25,793 and the Nasdaq Composite
Small Cap
(2.2)
(444)
19,603
edged down to 0.5%, to 7,224.
Bankex
(0.4)
(106)
29,356
U.K. shares were little changed as investor awaited U.K. inflation data due later in
the day for direction. The FTSE 100 was down by 0.2% to close at 7,756.
Global Indices
Chg (%)
(Pts)
(Close)
Dow Jones
(0.0)
(10)
25,793
On domestic front, Indian shares ended slightly lower as concerns over widening
Nasdaq
(0.5)
(37)
7,224
fiscal deficit and rising oil prices offset investor optimism over corporate earnings.
The Sensex dropped to 0.2% at 34,771 while the Nifty ended at 10,700 with an
FTSE
(0.2)
(13)
7,756
downside of 0.4%.
Nikkei
(0.4)
(97)
23,855
Hang Seng
(0.4)
(117)
31,788
News Analysis
Shanghai Com
0.7
24
3,460
TCS signs $690 million deal with Prudential Plc's unit
Detailed analysis on Pg2
Advances / Declines
BSE
NSE
Advances
735
340
Investor’s Ready Reckoner
Declines
2,264
1,491
Key Domestic & Global Indicators
Unchanged
110
40
Stock Watch: Latest investment recommendations on 150+ stocks
Refer Pg5 onwards
Volumes (` Cr)
Top Picks
BSE
7,663
CMP
Target
Upside
Company
Sector
Rating
(`)
(`)
(%)
NSE
38,603
Blue Star
Capital Goods Accumulate
757
867
14.5
Dewan Housing Finance
Financials
Buy
602
712
18.3
Net Inflows (` Cr)
Net
Mtd
Ytd
Asian Granito
Other
Accumulate
589
651
10.5
FII
153
1,763
1,763
Navkar Corporation
Other
Buy
204
265
30.2
*MFs
278
2,520
2,520
KEI Industries
Capital Goods Accumulate
401
436
8.9
More Top Picks on Pg4
Top Gainers
Price (`)
Chg (%)
Key Upcoming Events
Previous
Consensus
Justdial
638
5.3
Date
Region
Event Description
Reading
Expectations
Wipro
332
4.9
Jan17
Euro Zone Euro-Zone CPI (YoY)
1.40
1.40
Hcltech
949
4.6
Jan17
US
Initial Jobless claims
261.00
250.00
Infy
1,123
3.9
Jan18
US
Industrial Production
0.20
0.40
Jan18
US
Housing Starts
1,297.00
1,275.00
Tcs
2,851
3.8
Jan18
China
Real GDP (YoY)
6.80
6.70
More Events on Pg7
Top Losers
Price (`)
Chg (%)
Gnfc
485
(10.2)
Icil
121
(8.9)
Nationalum
79
(8.4)
Equitas
152
(7.6)
Federalbnk
105
(7.5)
As on January 16, 2018
Market Outlook
January 17, 2018
News Analysis
TCS signs $690 million deal with Prudential Plc's unit
Tata Consultancy Services India's largest IT services company, signed for $690
million deal with M&G Prudential, the UK and European savings and investments
business unit of Prudential Plc, to digitally transform their business and deliver
enhanced service for its UK savings and retirement customers.
This agreement is over 10 years and covers the support of over 4 million customer
policies. TCS will also assume responsibility for the operation of some of
Prudential's internal IT infrastructure to enable the IT operations function to deliver
greater flexibility in the provision of services to the businesses within the Prudential
Group.
Economic and Political News
After Qatar and Australia, GAIL India gets Russia to lower LNG import price
Centre plans to invest Rs 107bn to boost telecommunication in north east
Black money fight: Centre to deregister 120,000 firms for non-compliance
Global IT spending to hit $3.7 trillion in 2018 on AI, blockchain boost
Corporate News
Nalco seeks approval for Pottangi bauxite mining lease in Koraput
TCS wins $690mn deal with UK's M&G Prudential; second deal this year
Volkswagen Group evaluating fresh investments for new products in India
RIL to invest Rs 50bn in Bengal; to get 100% Jio coverage by December
Market Outlook
January 17, 2018
Quarterly Bloomberg Brokers Consensus Estimate
Hindustan Unilever Ltd - Jan 17, 2018
Particulars ( ` cr)
3QFY18E
3QFY17
y-o-y (%)
2QFY18
q-o-q (%)
Sales
8239
7706
6.9
8309
(0.8)
EBIDTA
1701
1350
26.0
1672
1.7
%
20.6
17.5
20.1
PAT
1212
1038
16.8
1276
(5.0)
Zee Entertainment - Jan 17, 2018
Particulars ( ` cr)
3QFY18E
3QFY17
y-o-y (%)
2QFY18
q-o-q (%)
Sales
1748
1639
6.6
1582
10.5
EBIDTA
570
440
29.5
476.4
19.6
%
32.6
26.9
30.1
PAT
400
250.8
59.5
590.8
(32.9)
Bharti Infratel - Jan 17, 2018
Particulars ( ` cr)
3QFY18E
3QFY17
y-o-y (%)
2QFY18
q-o-q (%)
Sales
3645
1530
138.2
1658.7
119.8
EBIDTA
1578
705.6
123.8
789.8
99.7
%
43.2
46.1
47.6
PAT
707
620.4
14.01
638.4
10.7
Market Outlook
January 17, 2018
Top Picks
Market Cap
CMP
Target
Upside
Company
Rationale
(` Cr)
(`)
(`)
(%)
Strong growth in domestic business due to its
leade`hip in acute therapeutic segment. Alkem expects
Alkem Laboratories
27,219
2,277
2,441
7.2
to launch more products in USA, which bodes for its
international business.
We expect the company would report strong
Asian Granito
1,773
589
651
10.5
profitability owing to better product mix, higher B2C
sales and amalgamation synergy.
Favorable outlook for the AC industry to augur well for
Cooling products business which is out pacing the
Blue Star
7,260
757
867
14.5
market growth. EMPPAC division's profitability to
improve once operating environment turns around.
With a focus on the low and medium income (LMI)
consumer segment, the company has increased its
Dewan Housing Finance
18,884
602
712
18.3
presence in tier-II & III cities where the growth
opportunity is immense.
Loan growth is likely to pick up after a sluggish FY17.
Lower credit cost will help in strong bottom-line
Karur Vysya Bank
8,863
122
160
31.1
growth. Increasing share of CASA will help in NIM
improvement.
High order book execution in EPC segment, rising B2C
KEI Industries
3,138
401
436
8.9
sales and higher exports to boost the revenues and
profitability
Expected to benefit from the lower capex requirement
Music Broadcast
2,368
415
475
14.4
and 15 year long radio broadcast licensing.
Massive capacity expansion along with rail advantage
Navkar Corporation
3,064
204
265
30.2
at ICD as well CFS augur well for the company
Strong brands and distribution network would boost
Siyaram Silk Mills
3,588
766
851
11.2
growth going ahead. Stock currently trades at an
inexpensive valuation.
Market leadership in Hindi news genre and no. 2
viewership ranking in English news genre, exit from the
TV Today Network
2,574
432
500
15.9
radio business, and anticipated growth in ad spends
by corporate to benefit the stock.
After GST, the company is expected to see higher
volumes along with improving product mix. The
Maruti Suzuki
2,81,554
9,321
10,619
13.9
Gujarat plant will also enable higher operating
leverage which will be margin accretive.
We expect loan book to grow at 24.3% over next two
GIC Housing
2,380
442
655
48.2
year; change in borrowing mix will help in NIM
improvement
We expect CPIL to report net Revenue/PAT CAGR of
~17%/16% over FY2017-20E mainly due to healthy
7,744
349
400
14.8
growth in plywood & lamination business, forayed into
Century Plyboards India
MDF & Particle boards on back of strong brand &
distribution network.
We expect sales/PAT to grow at 13.5%/20% over next
LT Foods
3,109
97
128
31.7
two years on the back of strong distribution network &
addition of new products in portfolio.
We expect sales/PAT to grow at 13%/16% over next
two years on the back of strong healthy demand in
Ruchira Papers
459
205
244
19.1
writing & printing paper and Kraft paper. Further,
China had banned making paper from waste pulp
which would benefit Indian paper companies.
We expect financialisation of savings and increasing
Aditya Birla Capital
39781
181
230
27.0
penetration in Insurance & Mutual fund would ensure
steady growth.
Source: Company, Angel Research
Market Outlook
January 17, 2018
Fundamental Call
Market Cap
CMP
Target
Upside
Company
Rationale
(` Cr)
(`)
(`)
(%)
CCL is likely to maintain the strong growth trajectory
CCL Products
3,956
297
360
21.1
over FY18-20 backed by capacity expansion and new
geographical foray
We forecast Nilkamal to report top-line CAGR of ~9%
to `2,635cr over FY17-20E on the back of healthy
Nilkamal
2,844
1,906
2,178
14.3
demand growth in plastic division. On the bottom-line
front, we estimate ~10% CAGR to `162cr owing to
improvement in volumes.
We expect sales/PAT to grow at 9%/14% over next two
years on the back of healthy demand growth in
Shreyans Industries
292
211
247
16.9
printing. Further, China had banned making paper
from waste pulp which would benefit Indian paper
companies.
The prism has diversified exposure in the different
segment such as Cement, Tile & ready mix concrete.
Prism Cement
7,482
149
160
7.6
Thus we believe, PCL is in the right place to capture
ongoing government spending on affordable housing
and infrastructure projects.
Source: Company, Angel Research
Market Outlook
January 17, 2018
Key Upcoming Events
Result Calendar
Date
Company
January 17, 2018
Hindustan Unilever, Zee Electronic, Infratel
January 18, 2018
UltraTech Cement, Infotech Enterprises, D B Corp, Hind. Zinc
Source: Bloomberg, Angel Research
Global economic events release calendar
Bloomberg Data
Date
Time
Country
Event Description
Unit
Period
Last Reported
Estimated
Jan 16, 2018
12:00 PMIndia
Monthly Wholesale Prices YoY%
% Change
Dec
3.58
4.00
Jan 17, 2018
3:30 PMEuro Zone Euro-Zone CPI (YoY)
%
Dec F
1.40
1.40
7:00 PMUS
Housing Starts
Thousands
Dec
1,297.00
1,275.00
Jan 18, 2018
7:45 PMUS
Industrial Production
%
Dec
0.20
0.40
7:00 PMUS
Initial Jobless claims
Thousands
Jan 13
261.00
250.00
7:00 PMUS
Building permits
Thousands
Dec
1,303.00
1,290.00
12:30 PMChina
Industrial Production (YoY)
% Change
Dec
6.10
6.10
12:30 PMChina
Real GDP (YoY)
% Change
4Q
6.80
6.70
Jan 23, 2018
8:30 PMEuro Zone Euro-Zone Consumer Confidence
Value
Jan A
0.50
Jan 24, 2018
2:00 PMGermany PMI Services
Value
Jan P
55.80
2:00 PMGermany PMI Manufacturing
Value
Jan P
63.30
8:30 PMUS
Existing home sales
Million
Dec
5.81
5.65
3:00 PMUK
Jobless claims change
% Change
Dec
5.90
Jan 25, 2018
8:30 PMUS
New home sales
Thousands
Dec
733.00
667.50
3:00 PMUK
GDP (YoY)
% Change
4Q A
1.70
Source: Bloomberg, Angel Research
Market Outlook
January 17, 2018
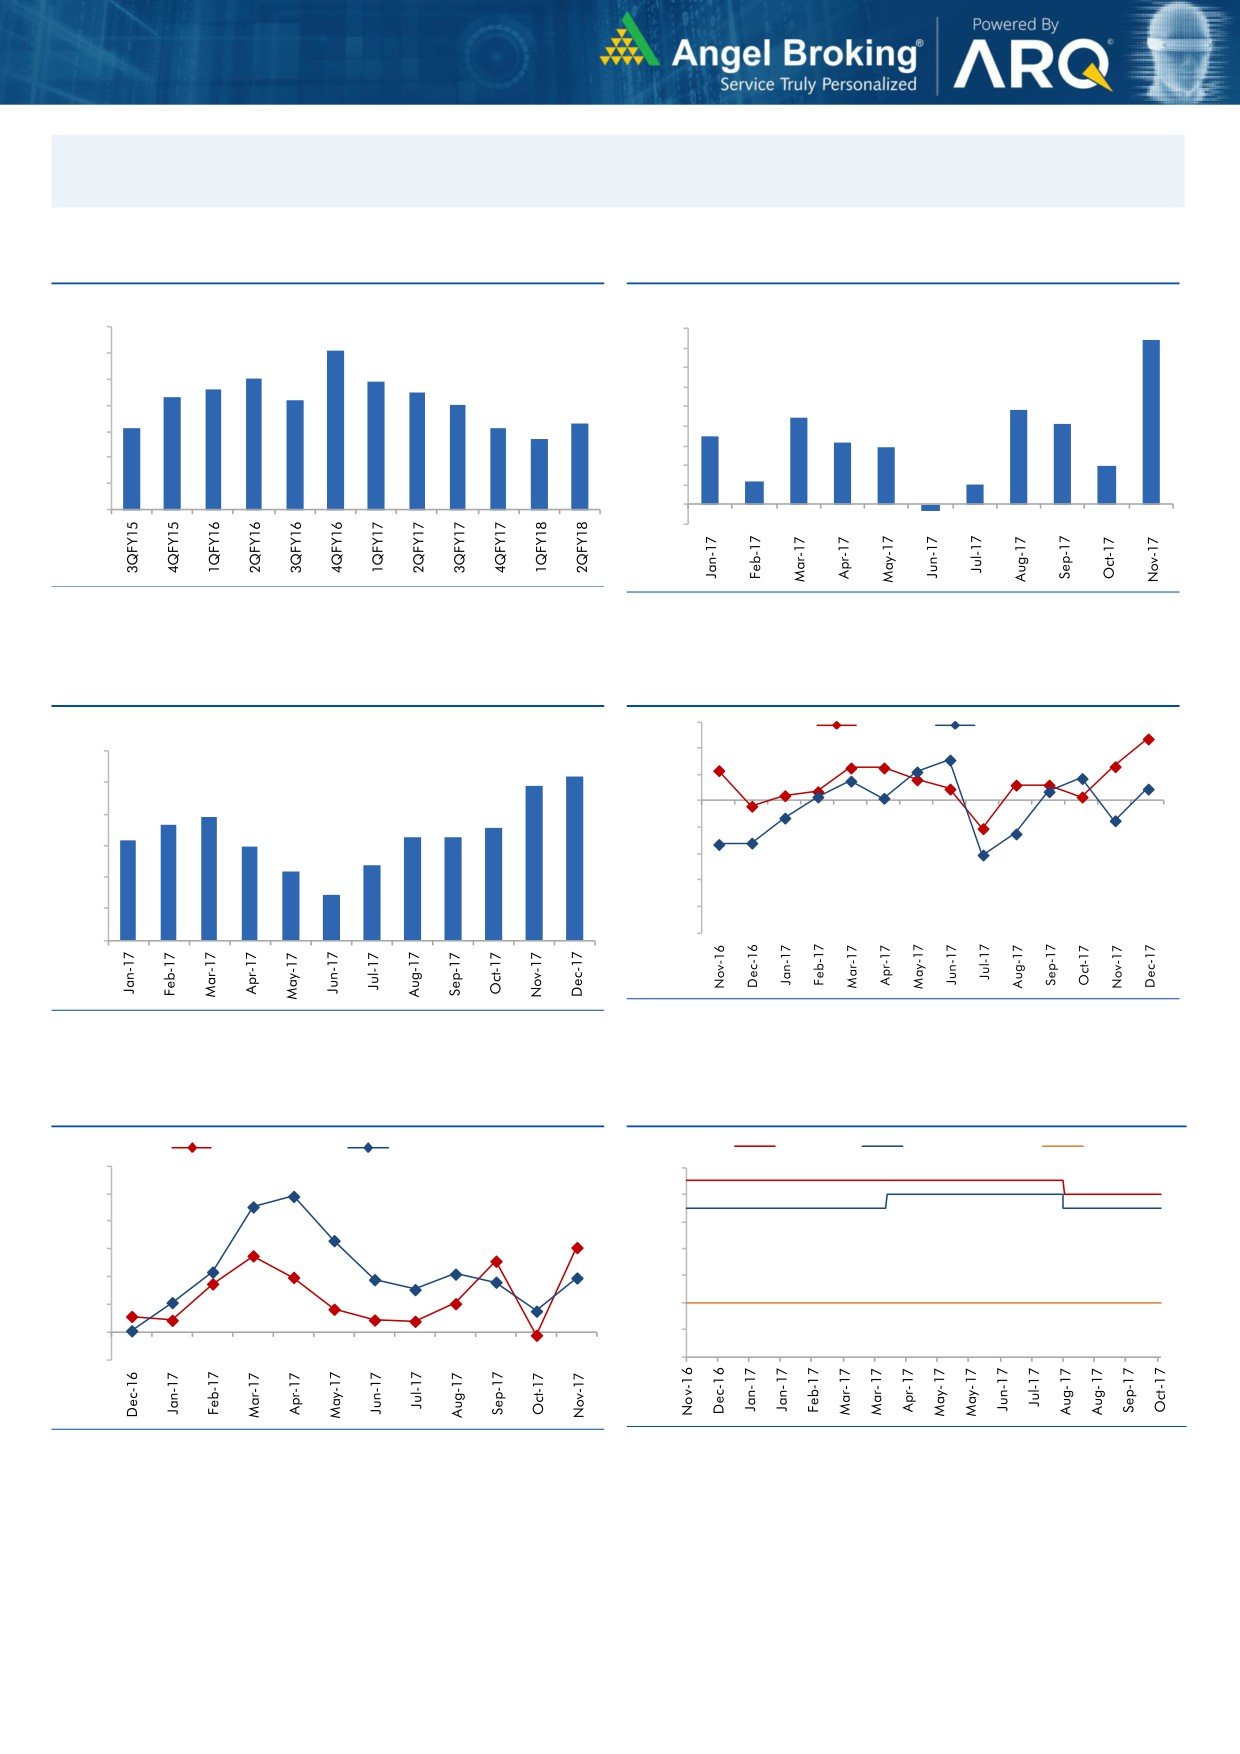
Macro watch
Exhibit 1: Quarterly GDP trends
Exhibit 2: IIP trends
(%)
(%)
10.0
9.0
8.4
9.1
9.0
8.0
8.0
7.9
7.0
7.6
7.5
8.0
7.3
7.2
7.0
6.0
4.8
7.0
6.3
5.0
4.4
4.1
6.1
6.1
5.7
3.5
3.2
6.0
4.0
2.9
3.0
2.0
5.0
2.0
1.2
1.0
4.0
1.0
-
3.0
(1.0)
(0.3)
Source: CSO, Angel Research
Source: MOSPI, Angel Research
Exhibit 3: Monthly CPI inflation trends
Exhibit 4: Manufacturing and services PMI
56.0
Mfg. PMI
Services PMI
(%)
6.0
54.0
5.2
4.9
52.0
5.0
3.9
50.0
3.7
3.6
4.0
3.3
3.3
3.2
3.0
48.0
3.0
2.4
2.2
46.0
2.0
1.5
44.0
1.0
42.0
40.0
-
Source: Market, Angel Research; Note: Level above 50 indicates expansion
Source: MOSPI, Angel Research
Exhibit 5: Exports and imports growth trends
Exhibit 6: Key policy rates
(%)
Exports yoy growth
Imports yoy growth
(%)
Repo rate
Reverse Repo rate
CRR
60.0
6.50
50.0
6.00
40.0
5.50
30.0
5.00
20.0
4.50
10.0
4.00
0.0
3.50
(10.0)
3.00
Source: Bloomberg, Angel Research
Source: RBI, Angel Research
Market Outlook
January 17, 2018
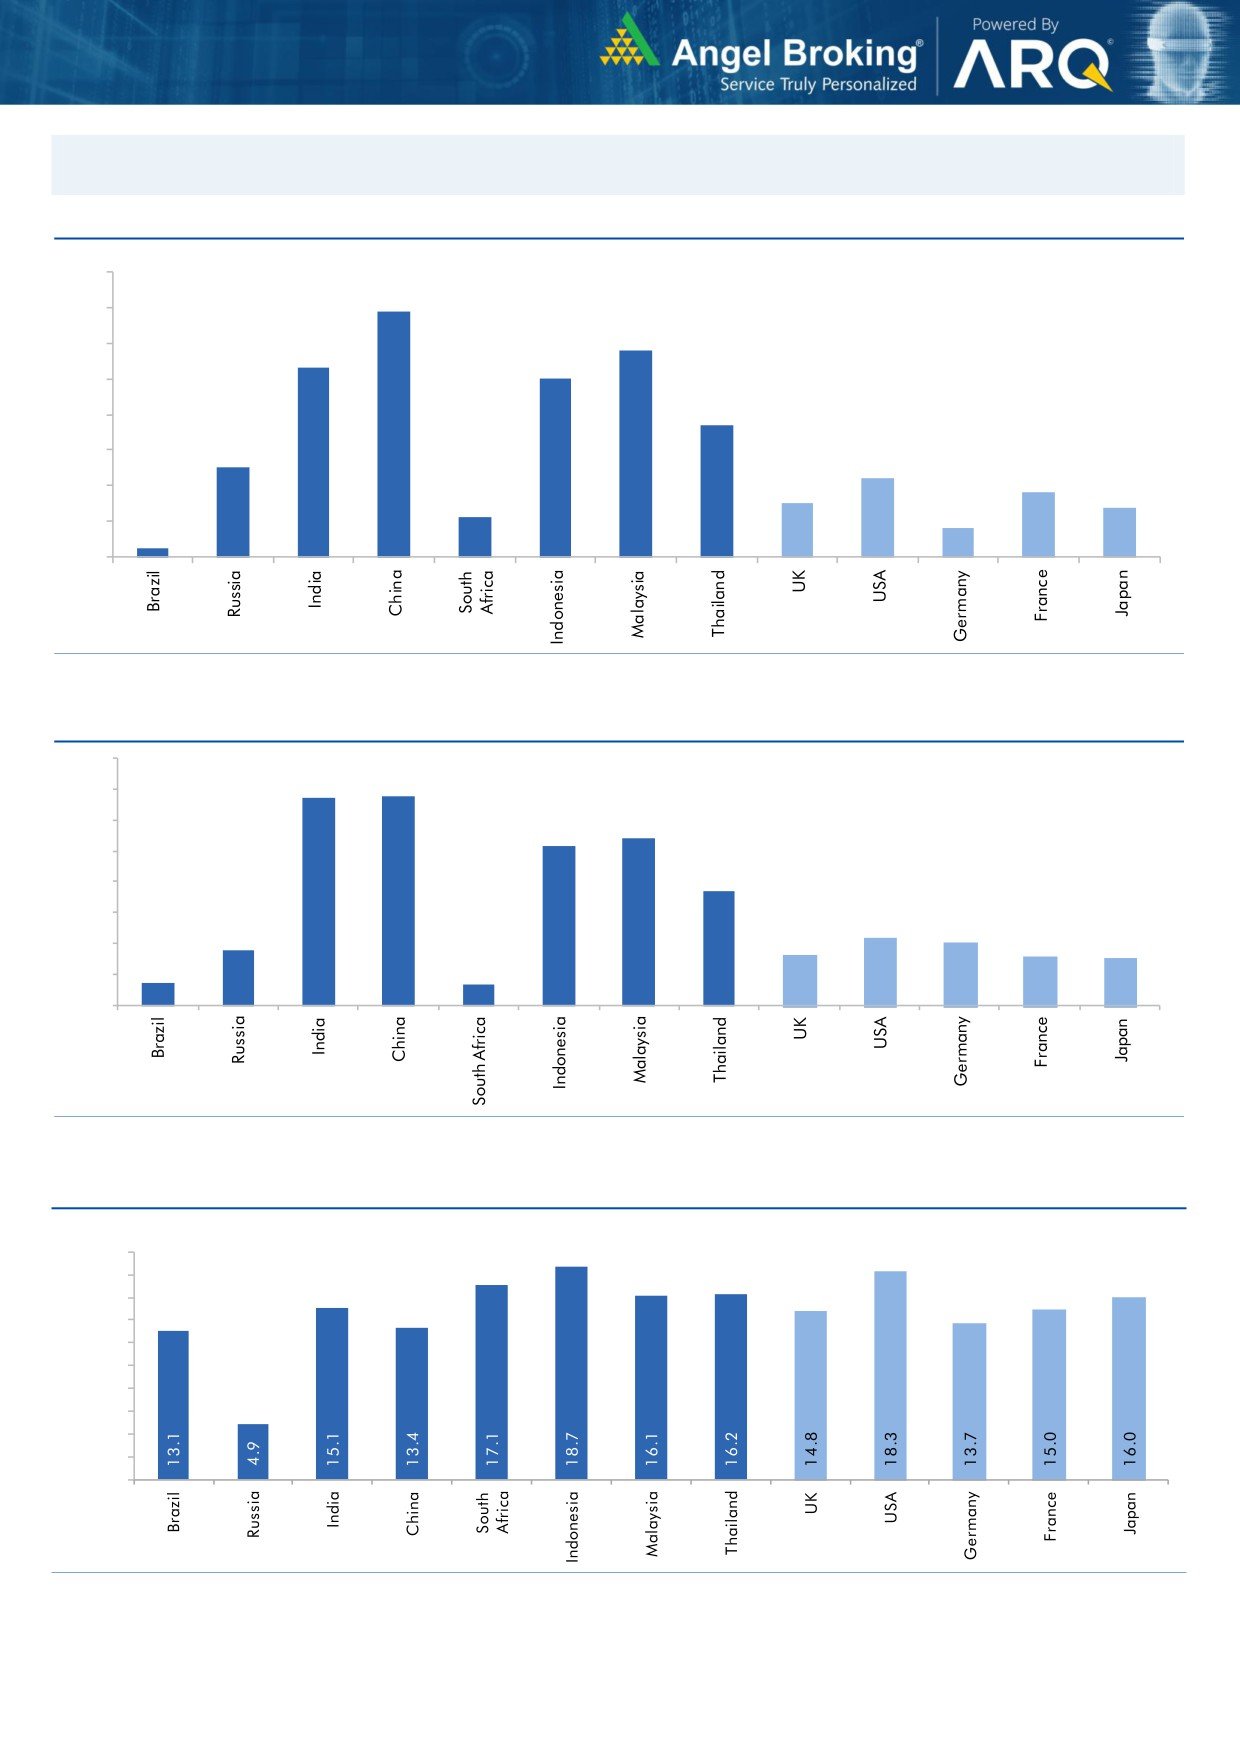
Global watch
Exhibit 1: Latest quarterly GDP Growth (%, yoy) across select developing and developed countries
(%)
8.0
6.9
7.0
5.8
6.0
5.3
5.0
5.0
1.1
3.7
4.0
2.5
3.0
2.2
1.8
2.0
1.5
1.4
0.8
1.0
0.3
-
Source: Bloomberg, Angel Research
Exhibit 2: 2017 GDP Growth projection by IMF (%, yoy) across select developing and developed countries
(%)
6.7
6.8
7.0
6.0
5.4
5.2
5.0
3.7
4.0
3.0
1.8
2.2
2.0
1.7
1.6
2.0
0.7
1.5
0.7
1.0
-
Source: IMF, Angel Research
Exhibit 3: One year forward P-E ratio across select developing and developed countries
(x)
20.0
18.0
16.0
14.0
12.0
10.0
8.0
6.0
4.0
2.0
-
Source: IMF, Angel Research
Market Outlook
January 17, 2018
Exhibit 4: Relative performance of indices across globe
Returns (%)
Country
Name of index
Closing price
1M
3M
1YR
Brazil
Bovespa
79,832
8.2
5.4
29.4
Russia
Micex
2,258
4.5
7.8
3.1
India
Nifty
10,700
4.4
4.6
27.3
China
Shanghai Composite
3,437
6.0
2.4
9.2
South Africa
Top 40
53,778
4.8
4.5
16.7
Mexico
Mexbol
49,492
2.5
(1.3)
8.2
Indonesia
LQ45
1,093
6.9
10.7
23.0
Malaysia
KLCI
1,826
5.1
4.1
9.0
Thailand
SET 50
1,187
7.5
9.9
20.6
USA
Dow Jones
25,793
5.3
12.9
30.1
UK
FTSE
7,756
3.4
2.9
7.0
Japan
Nikkei
23,952
4.4
15.0
24.1
Germany
DAX
13,246
0.5
2.0
14.8
France
CAC
5,514
1.6
3.0
13.7
Source: Bloomberg, Angel Research p68in4
Market Outlook
January 17, 2018
Research Team Tel: 022 - 39357800
DISCLAIMER
Angel Broking Private Limited (hereinafter referred to as “Angel”) is a registered Member of National Stock Exchange of India
Limited,Bombay Stock Exchange Limited and Metropolitan Stock Exchange Limited. It is also registered as a Depository Participant with
CDSL and Portfolio Manager with SEBI. It also has registration with AMFI as a Mutual Fund Distributor. Angel Broking Private Limited is a
registered entity with SEBI for Research Analyst in terms of SEBI (Research Analyst) Regulations, 2014 vide registration number
INH000000164. Angel or its associates has not been debarred/ suspended by SEBI or any other regulatory authority for accessing
/dealing in securities Market. Angel or its associates/analyst has not received any compensation / managed or
co-managed public offering of securities of the company covered by Analyst during the past twelve months.
This document is solely for the personal information of the recipient, and must not be singularly used as the basis of any investment
decision. Nothing in this document should be construed as investment or financial advice. Each recipient of this document should make
such investigations as they deem necessary to arrive at an independent evaluation of an investment in the securities of the companies
referred to in this document (including the merits and risks involved), and should consult their own advisors to determine the merits and
risks of such an investment.
Reports based on technical and derivative analysis center on studying charts of a stock's price movement, outstanding positions and
trading volume, as opposed to focusing on a company's fundamentals and, as such, may not match with a report on a company's
fundamentals. Investors are advised to refer the Fundamental and Technical Research Reports available on our website to evaluate the
contrary view, if any.
The information in this document has been printed on the basis of publicly available information, internal data and other reliable
sources believed to be true, but we do not represent that it is accurate or complete and it should not be relied on as such, as this
document is for general guidance only. Angel Broking Pvt. Limited or any of its affiliates/ group companies shall not be in any way
responsible for any loss or damage that may arise to any person from any inadvertent error in the information contained in this report.
Angel Broking Pvt. Limited has not independently verified all the information contained within this document. Accordingly, we cannot
testify, nor make any representation or warranty, express or implied, to the accuracy, contents or data contained within this document.
While Angel Broking Pvt. Limited endeavors to update on a reasonable basis the information discussed in this material, there may be
regulatory, compliance, or other reasons that prevent us from doing so.
This document is being supplied to you solely for your information, and its contents, information or data may not be reproduced,
redistributed or passed on, directly or indirectly.
Neither Angel Broking Pvt. Limited, nor its directors, employees or affiliates shall be liable for any loss or damage that may arise from
or in connection with the use of this information.